Excel Tables are an incredibly powerful tool for managing and analyzing data. They provide a structured format for your data, allowing you to easily add, remove, or modify data within the table. In this article, we will explore the many benefits of Excel Tables and how to use them to manage, sort, and filter data more efficiently.
Table of Contents
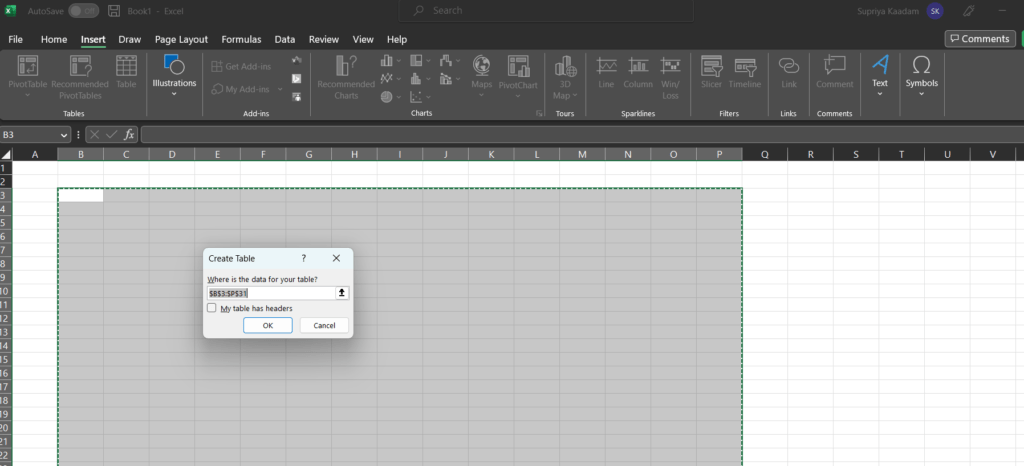
Creating an Excel Table

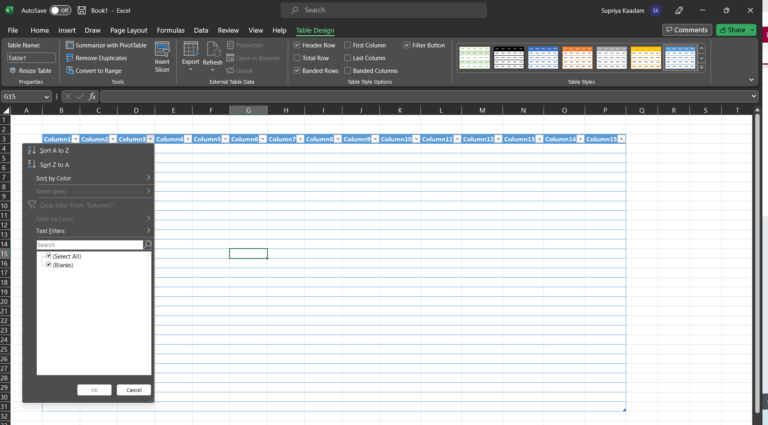
Another powerful feature of Excel Tables is that they have built-in formatting options. When you create an Excel Table, Excel will automatically format the table with alternating row colors and bold headers. This makes it easier to read and analyze the data in the table. Additionally, Excel Tables have a built-in filter dropdown that allows you to quickly sort and filter the data within the table.
Using Excel Tables to Manage Data
Excel Tables provide a structured format for your data, which makes it easier to manage and analyze. One of the most significant advantages of using an Excel Table is that you can easily add new data to the table without having to manually adjust any formulas or charts that reference the data. This is because Excel Tables have a dynamic range that automatically expands or contracts as you add or remove data from the table.
Another advantage of using an Excel Table is that you can easily modify existing data within the table. For example, if you have a list of products in your table and you need to change the price of one of the products, you can simply update the price within the table, and Excel will automatically update any calculations or charts that reference that data.
Using Excel Tables to Sort and Filter Data

Excel Tables provide powerful sorting and filtering options that allow you to quickly analyze and summarize your data. One of the most useful features of Excel Tables is the filter dropdown. This allows you to filter the data in the table based on specific criteria. For example, if you have a table of sales data, you could filter the table to show only sales for a specific product, or sales within a specific date range.
Another useful feature of Excel Tables is the ability to sort the data within the table. To sort the data, simply click on the header of the column you want to sort by. Excel will automatically sort the data in the table based on the values in that column. You can also sort the data by multiple columns by holding down the “Shift” key and clicking on additional column headers.
Using Excel Tables to Perform Calculations
Excel Tables have built-in calculations that allow you to quickly perform common calculations on your data. For example, you can use the “SUM” function to add up the values in a column, or the “AVERAGE” function to calculate the average value in a column. To perform a calculation on the data within an Excel Table, simply click on the cell where you want to display the result of the calculation and type in the appropriate formula


